The scripts we used for creating topics in Confluent Cloud and for running Waterstream in Google Cloud are here: https://github.com/simplematter/waterstream-gcp-terraform. This setup has a single Kafka topic for MQTT messages with 10 partitions (in Confluent Cloud cluster capacity depends on number of partitions). For Waterstream deployment, we’ve used 5 n1-standard-1 nodes (1 CPU, 3.75 GB RAM). A separate VM hosts Prometheus and Grafana, which we’re going to use for monitoring Waterstream behavior during a simulated node failure.
The scripts we used for creating topics in Confluent Cloud and for running Waterstream in Google Cloud are here: https://github.com/simplematter/waterstream-gcp-terraform. This setup has a single Kafka topic for MQTT messages with 10 partitions (in Confluent Cloud cluster capacity depends on number of partitions). For Waterstream deployment, we’ve used 5 n1-standard-1 nodes (1 CPU, 3.75 GB RAM). A separate VM hosts Prometheus and Grafana, which we’re going to use for monitoring Waterstream behavior during a simulated node failure. MQTT load generator also has scripts for launching it on Google Cloud.
We’ve configured it to run 5 nodes on the same machine type – n1-standard-1. Each node spawns 20k clients with ramp-up time 120 seconds. Together that makes 100k clients. When ramp-up completes, each clients sends 0.8… 1.2 KB QoS 2 (exactly once) PUBLISH message every 10 seconds. Clean Session flag for all the clients is false, so that we could also test the loading of the session data upon client reconnect.
Having all this infrastructure started, we’ve waited few minutes to see all the clients connected and produce messages and expected.
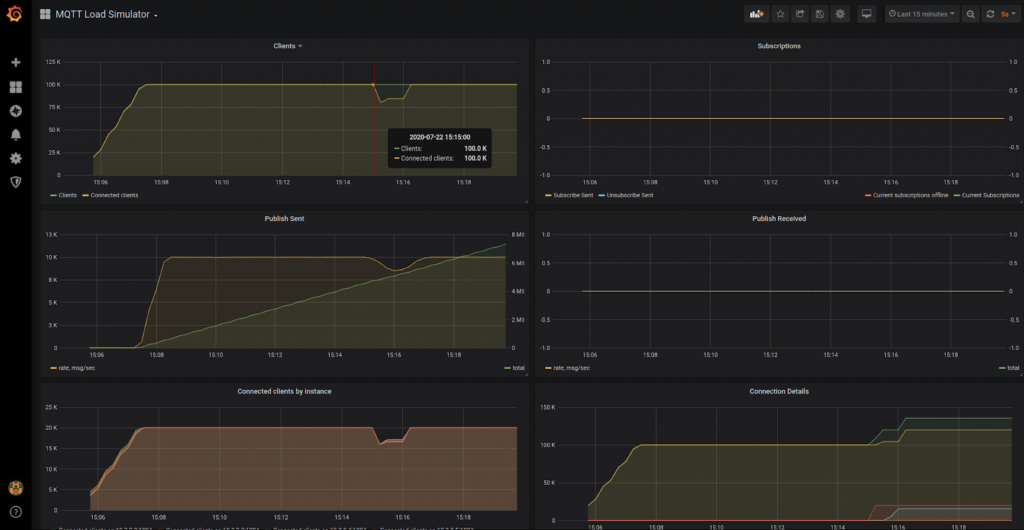
The load simulator before stopping a node - see the red line
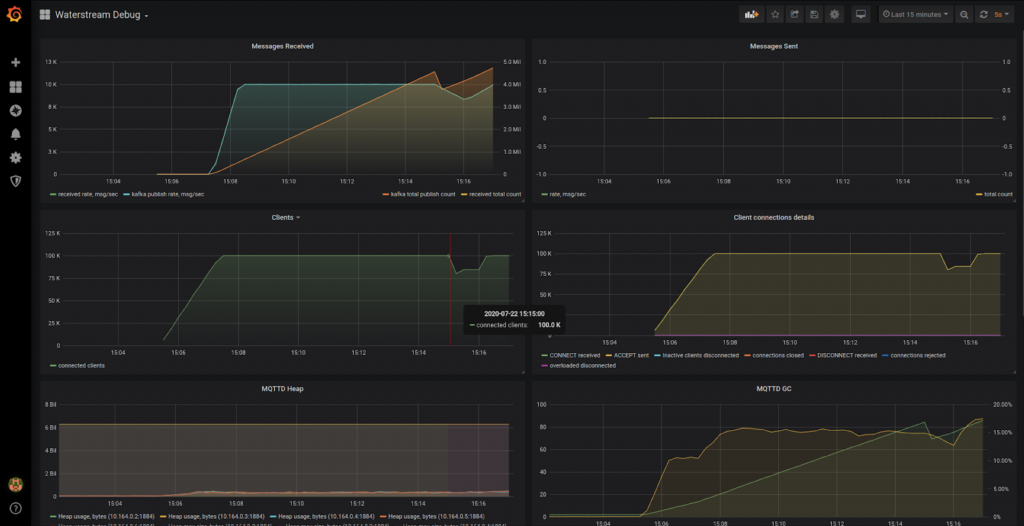
Waterstream connected clients before stopping a node - see the red line
Then we opened a console of one of the Waterstream nodes and shut down the Docker container of the Waterstream and watch Waterstream Grafana dashboard to see the effect:
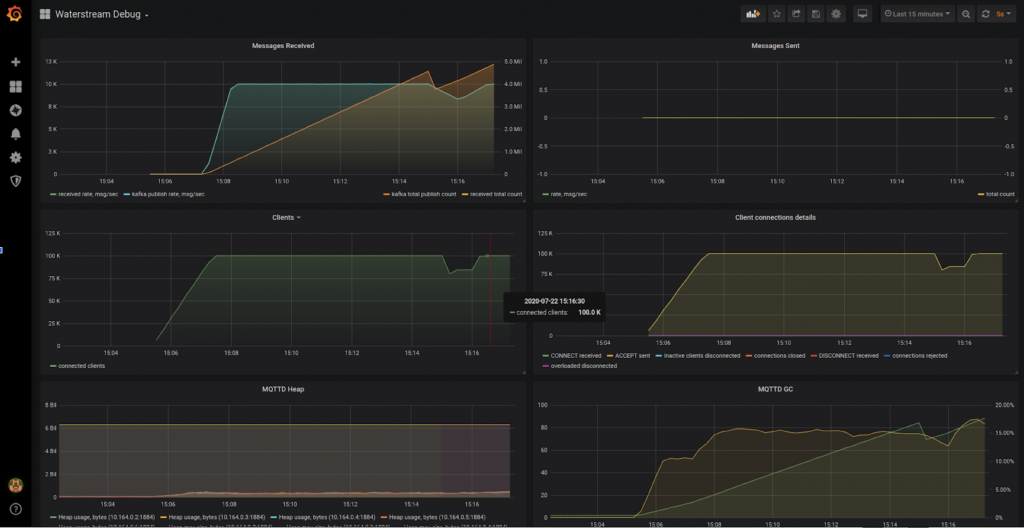
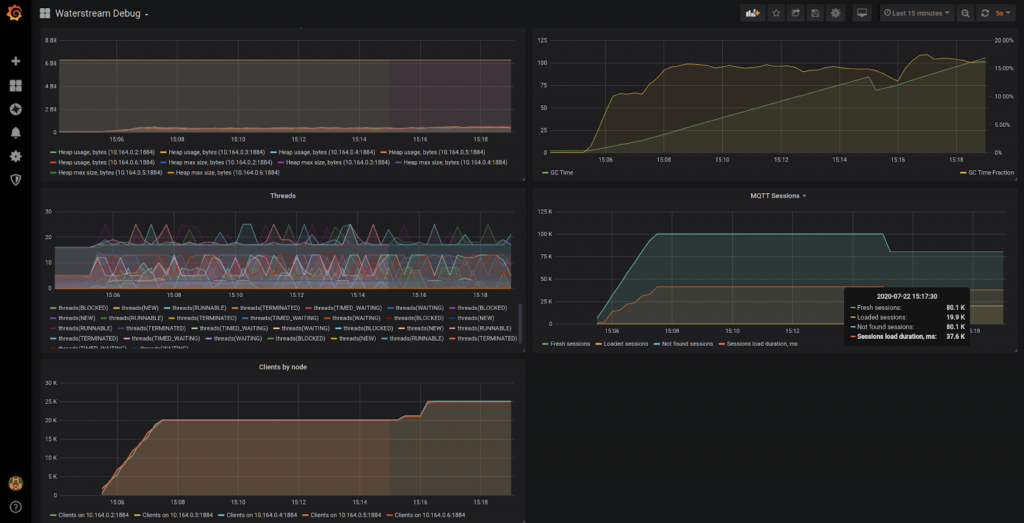
Waterstream rebalancing the load of survivor nodes - see the red line
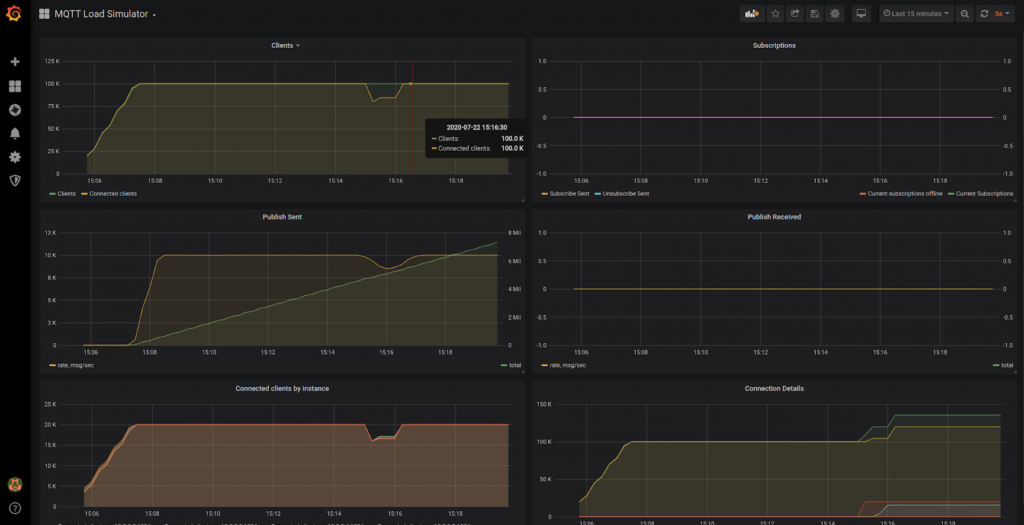
As you can see, after a while clients started to notice that connections are broken and they need to re-connect. 1 minute 45 seconds after the start of the simulated incident all the clients have successfully connected to the survivor nodes. Looking at the connection details in the Load Simulator Waterstream dashboard we can see that there were 19.9k connections with the node that went down and that there were some unsuccessful attempts to re-connect while the load balancer hadn’t yet detected the node failure:
The load simulator shows restoring clients on the survivor Waterstream nodes - see the red line
And here is the part of the Waterstream dashboard that shows the session loading metrics. You may see that it has successfully loaded existing sessions for the clients that were re-connecting.
As the tests are complete, shut down load generator and Waterstream, and remove topics from Confluent Cloud to stop being charged.
This test demonstrates how survivor Waterstream nodes may take over the load of the failed one, keep the cluster running and client sessions available. If you want to repeat these tests yourselves you can ask evaluation license here and get support on our forum.